Back
































































 Shipping & Fulfillment


Delivery data is everywhere. Carrier portals. Tracking pages. Exports. Reports with more tabs than anyone has time to read.
Most ecommerce teams don’t lack numbers. They lack the right ones.
The right delivery KPIs (key performance indicators) show you what to fix, not just what happened. The wrong ones fill a dashboard and leave you guessing.
Carriers report what’s easy to report. Parcels collected. Parcels scanned. Parcels marked “delivered.”
None of that tells you whether you kept your promise to the customer.
A useful delivery KPI does three things. It reflects what your customer experiences, not just what a carrier logs. It points to something you can change, such as a carrier, a service, or a process. And it connects to money, whether that’s cost, repeat purchases, or support workload.
Run every metric through those three filters. The ones that fail go in the vanity pile.
This is the headline number. What percentage of delivered parcels arrived on or before the estimated delivery date?
Overall rate is only the start. The real insight comes from splitting it by carrier and by service. A strong overall figure can hide one service that’s quietly missing its estimate, and that’s the one generating your complaints.
ShipStation’s help centre notes that benchmarks vary by carrier and service, but most businesses aim for 95% or higher.
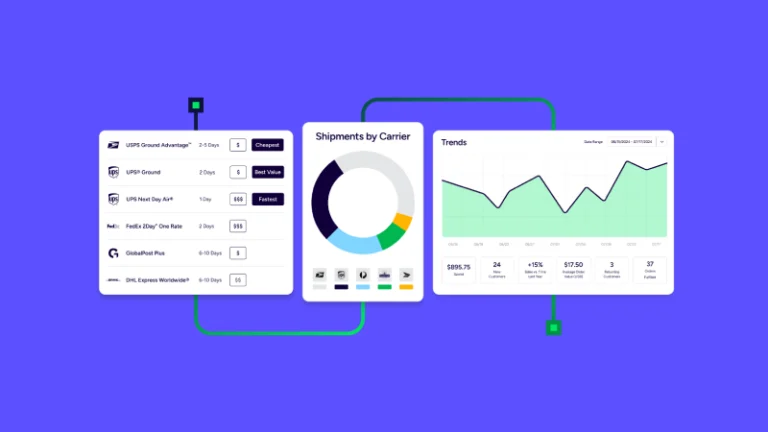
In ShipStation: The Carrier Performance dashboard shows the percentage of shipments delivered on time, the number on time versus not on time, and the average gap between actual and estimated delivery in days. You can filter by carrier, service, and warehouse. It only counts shipments with a confirmed delivery scan, and it measures against the carrier’s estimated date at label creation. If you promise customers something tighter, compare the two yourself.
Here’s the metric most teams skip, because it sits on your side of the fence rather than the carrier’s.
Fulfilment time is how long it takes to get from the moment an order comes in to the moment a label is created. It’s the one part of delivery you fully control, and it’s often the biggest source of “late” parcels.
Think about a customer who orders just after your dispatch cut-off. Their parcel waits a full day before it even leaves the building. The carrier then performs perfectly, and the customer still waits two days. The carrier didn’t miss the target. You did.
Don’t just watch the average. Watch the slow tail. A median of a few hours can sit alongside a handful of orders that wait three days, and those are the ones that become one-star reviews.
In ShipStation: The Order Processing dashboard shows average fulfilment time in hours, plus orders bucketed by age at label creation: 0–24 hours, 24–48 hours, 48–72 hours, and 72+ hours. A daily trend line makes it easy to spot the days things slipped, like a busy Monday or a missed collection.
What share of your parcels hit a problem on the way?
An exception is a carrier-flagged issue: a wrong address, a refused parcel, a misrouted shipment. Each one means a customer who’s waiting, a support query, and possibly a reshipment you pay for twice.
The pattern matters as much as the number. If most exceptions are address issues, that points to checkout data quality, not a carrier problem. If they cluster on one service, you’ve found the culprit. ShipStation’s help centre suggests a rate under 1–2% is generally healthy, and a spike is a signal to investigate.
Pro-Tip: Check the shipments sitting in “Not Yet In System” status. These are labels created and printed that the carrier hasn’t scanned. If they stay there for more than a day or two, the parcel may never have been handed over.
In ShipStation: The Shipment Tracking dashboard shows exceptions as a count and a rate, grouped by exception reason, with a list of every affected order and tracking number. Treat that list as a daily action list. It refreshes once a day, so a morning check is plenty.
Speed matters, but only when you can see it in detail.
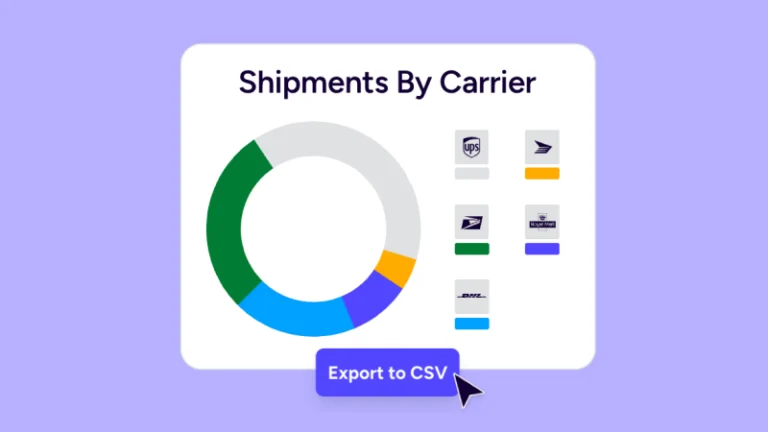
Overall average transit time is a blended number that hides more than it tells. Break it down by carrier and service, and you can check whether your faster, pricier options are really worth the premium. You can also see whether a cheaper service is slower than the checkout page implies.
That’s the question to ask: is the service you’re paying for delivering the speed you’re promising?
In ShipStation: The Carrier Performance dashboard shows average days in transit, with tables by carrier and by service, measured from label creation to confirmed delivery.
Your delivery numbers don’t mean much until you know where the orders come from.
Orders by sales channel shows how many orders each channel brings in, and what happens to them. A channel that looks like a star on sales can have a higher cancellation rate, or a growing pile of orders still waiting to ship. Another might be small but problem-free. Without the split, you’re averaging them together and fixing nothing.
It also tells you where to point your other KPIs. If one channel drives most of your orders, a weak on-time rate on that channel’s deliveries costs you far more than the same rate on a quiet one.
Look at the status mix for each channel, not just the volume. A high share of cancelled orders can point to stock, pricing, or checkout friction. A persistently large “awaiting shipment” share suggests a fulfilment backlog on that channel.
In ShipStation: The Order Processing dashboard has an Orders by Marketplace chart. It shows order volume by sales channel, with each bar split by status: shipped, awaiting shipment, on hold, awaiting payment, and cancelled. ShipStation’s help centre says it helps you see which channels drive the most volume and whether fulfilment performance or cancellation rates differ between them. You can filter by order date, label create date, store, warehouse, and status. The dashboard shows a snapshot as of the last daily refresh, so a weekly check is plenty.
These metrics are still useful, but they don’t tell you what to do next.
If you can’t name a decision a metric would change, it’s a vanity metric.
You don’t need a data team. You need one place where orders, labels, and carrier tracking meet.
Start with a weekly review of these five KPIs, split by carrier and service. Look for one thing: the biggest gap between what you expected and what happened. Fix that, then move to the next.
That’s where a fulfilment platform like ShipStation earns its place. When your order, label, and carrier data live in one system, the dashboards above are already built from the same source. That saves you the three-spreadsheet project nobody wants to own, and it lets you act on what you find, such as switching a service that keeps missing its estimate.
Track what the customer experiences, not what a carrier reports. The five delivery KPIs worth your attention are on-time delivery rate, average fulfilment time, delivery exception rate, transit time by carrier and service, and orders by sales channel. Together they show whether you’re keeping your promises, where deliveries break down, and where your orders come from.
Ready to see what your delivery data is really telling you? Start your free ShipStation trial and put on-time delivery, fulfilment time, exceptions, and shipping costs in one place.