Social Media Trends To Look Out For in 2017 Part 2
In Part 1 we talked about the importance of keeping on top of all the latest trends happening in the social media sphere. We talked about Live Video Streaming, Paid Social, and 360 Images/Videos. In Part 2 we focus on Sales & Service getting more involved in your social media, Infographics still being an important content tool and the benefits of video marketing. So let’s begin;
- Sales and Service getting more involved in Social.
At ShipStation this is something we pride ourselves on. We understand the importance of getting back to our users as quick as possible. If they are having issues printing labels, this stops them from shipping on time and leads to unhappy customers. If you look at what is happening with airlines these days, any issues or complaints are now getting directed to their social media channels as they know they will get an immediate response. An example of an airline that does it right, is Southwest Airlines, they have a team that responds immediately and do it with a good sense of humor (when appropriate).
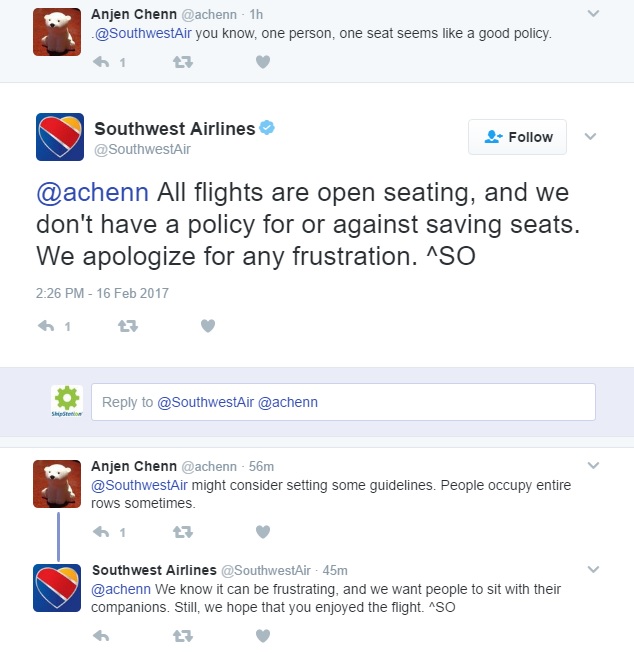
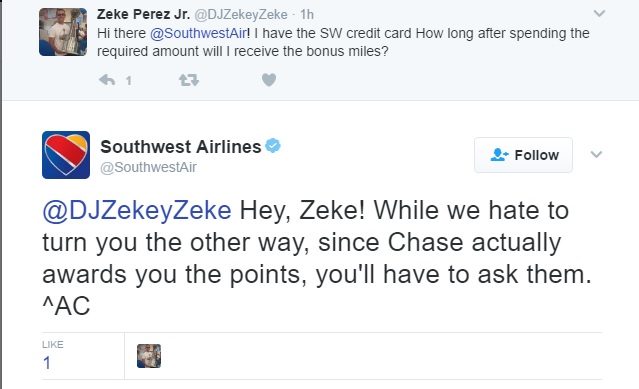
According to Search Engine Watch “Users expect that a brand needs to have a social team on their feed to answer questions and resolve issues. 72% of twitter users expect responses from brands they follow, within the hour”.
2. Infographics
Infographics have been around for a while now but they still continue to play a big part in 2017. Don’t Tell Anyone explains exactly why infographics work;
• It makes the information more appealing. Did you know that 70% of your sensory receptors are in your eyes? Almost 50% of your brain is involved in visual processing, and we can get the sense of a visual scene in less than 1/10 of a second! With infographics, information is presented with more appeal which makes it more effective than mere words and text. The creative use of colors, lines, and shapes makes it unique.
• It’s easier to understand. Infographics help because we suffer from information overload: we receive 5x as much information today as we did in 1986. 34 gigabytes or 100,500 words – the amount of information we consume outside of work on an average day. On average users only read 28% of words per visit. With the infographics and any graphic images you won’t have to break your brains trying to understand long pages of data and numbers because you can easily get the idea with a single glance at an infographic.
• They are more engaging. Complex information will certainly bore you. Who would spend a lot of time reading pages of info? Who would spend a lot of time understanding complicated facts and figures? Well, some would still do that but most people won’t. It seems like a waste of time when you can actually get info in a simpler manner through infographics. Researchers found that color visuals increase the willingness to read by 80%.
• They are accessible. A study found that when it comes to comprehension rates of medicine labels: 70% rate of understanding for labels with text only, 95% rate of understanding for labels with text and pictures. People following directions with text and illustrations do 23% better than people following directions without illustrations.
• They are more persuasive. Due to its unique way of presenting information and its clear manner of arrangement, it can easily persuade the readers. It is more convincing and influencing. The readers would less likely doubt the data they are seeing. Of course, no one would waste effort in designing such a great infographic to merely lie about information.
• They are easy to recall. People remember: 10% of what they hear, 20% of what they read, and 80% of what they SEE and DO. That is why television advertisements are effective because of the use of visual presentation. Infographics give a similar effect.
Also you can sometimes bring the simplest of designs to life by making them interactive. Recently at ShipStation we made our trade show schedule, interactive. See below;

3. Benefits of video marketing
According to Hubspot video is helping businesses achieve key business goals.
- 97% said that video had helped them increase user understanding of their product or service.
- 81% linked it to a direct increase in sales.
- 76% felt that video had increased traffic to their website.
- Over half (53%) said video had helped them decreased support call volume.
83% felt that, overall, video gave them a good ROI — which, again, compares favorably to 76% a year ago.
It looks like video will continue to become more widespread. Unsurprisingly, 99% of businesses currently using video reported that they plan to continue into 2017. And, what’s more, 34% of those currently not invested in video plan to start during the coming year.
Regarding the consumers, 79% say they’d rather watch a video to learn about a product than read text on a page. 84% said that they’d been convinced to make a purchase after watching a brand’s video.
An example of this is a colleague who saw this cool video below and was instantly inspired to purchase the mattress;
Keep a look out for Part 3 coming next week.
Featured image from amstore innovation