


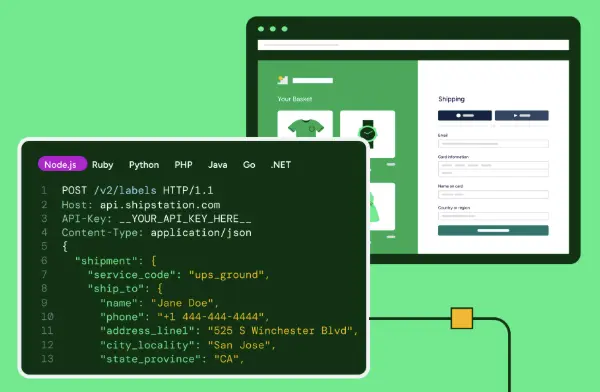
 Shipping Basics


This blog is contributed by Jennifer Wing, Marketing Director at Zenventory, a powerful and easy-to-use inventory management software.

Quality control in the warehouse is important to the success of an ecommerce business. However, some warehouse managers feel quality control slows operations. Thus, it is rarely applied. Or in some cases, it is only partially applied and is often discarded in the hustle and bustle of the warehouse.
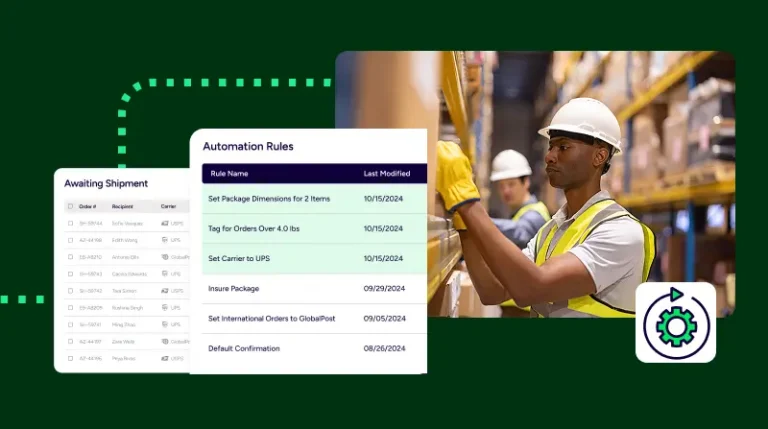
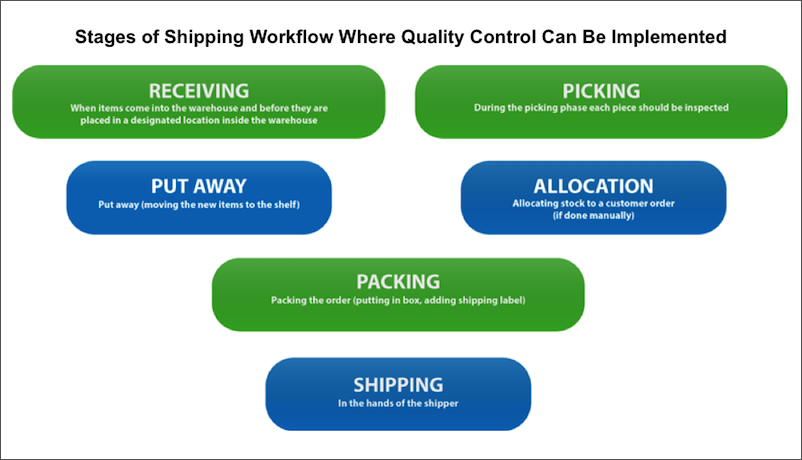
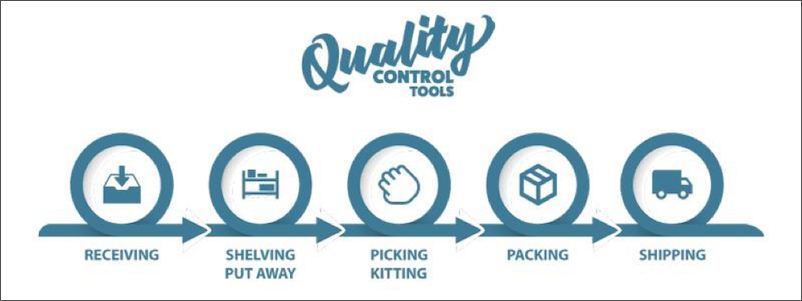
You can apply warehouse quality control techniques during receiving, picking, and packing. And creating quality control checkpoints in each stage of the shipping workflow can reduce fulfillment errors. The green areas in the image below signify stages where managers can implement quality control measures. It is not uncommon to have more than one quality control checkpoint.
This breakdown in quality control usually occurs at times when delivery speed is the overwhelming focus. The irony is that high-pressure situations, or fast-moving workflows, are precisely when most problems occur. Often when a company bypasses warehouse quality control in favor of quick fulfillment, the wrong (or defective) products are shipped. These mistakes are compounded if you’re running multiple warehouses or in the process of trying to scale up to a larger operation.
But by looking at data, warehouse managers can see which errors occur most often and when. In turn, they’ll realize the importance of inspecting orders before shipping. This is true even when — and especially when — orders are time-sensitive or the workflow is moving at a higher than average speed.
Dr. Kaoru Ishikawa identified seven warehouse quality control tools that help organizations troubleshoot errors. Quality control benefits a warehouse in that it should successfully catch issues early on and limit any future mistakes. This can help tighten up inefficient processes or aid in diagnosing a specific problem and improve warehouse efficiency.
Below are illustrations and examples of these seven quality control tools.
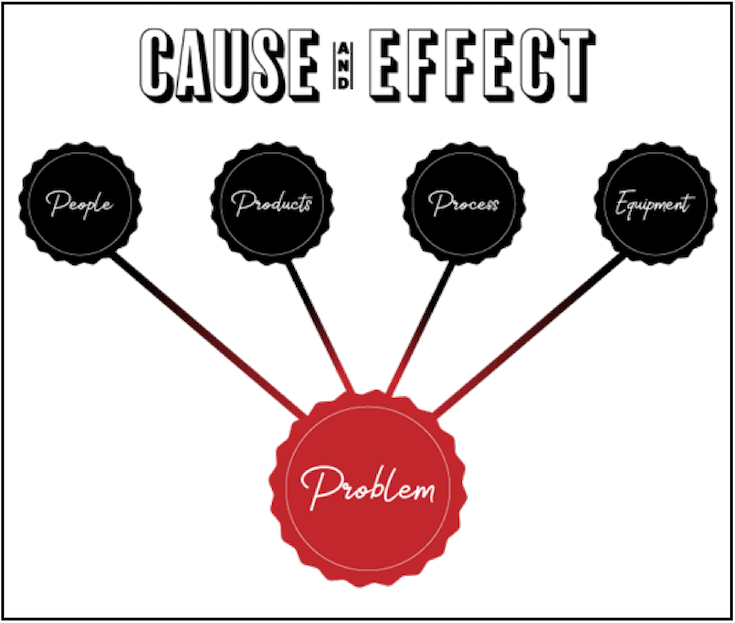
A cause-and-effect diagram (also referred to as the Ishikawa or a fishbone diagram) shows the potential causes of a specific issue. To create a cause-and-effect diagram, a warehouse manager brainstorms with his team to come up with a list of every possible reason for an error.
For example, the warehouse team may be consistently forgetting to include packing slips. Everyone works together to disqualify the less likely causes and identify the most probable reason. Then they develop a solution to prevent the problem from reoccurring.
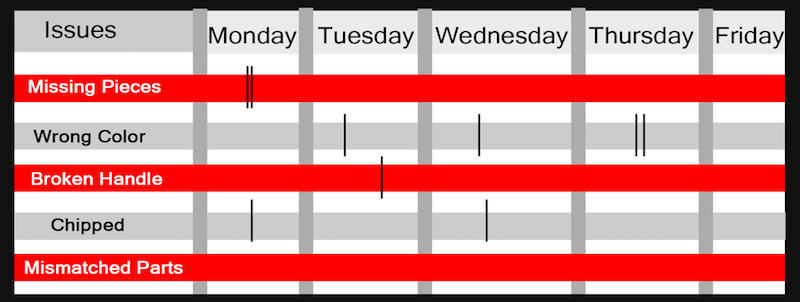
Check sheets are the most adaptable tool on Ishikawa’s list. Warehouse employees can use check sheets to mark off daily tasks, count inventory, or (as in the example below) record the days on which issue occurred. The increase in responsibility on the part of workers is beneficial to encouraging workers to check their work. Managers can use check sheets to identify patterns and make more informed decisions about how to run the warehouse.
A flowchart (sometimes called stratification or run chart) illustrates each separate step in a workflow. Using a workflow can assist in determining which part of the workflow requires more scrutiny. It also helps warehouse teams make incremental changes instead of overhauling the entire shipping workflow.
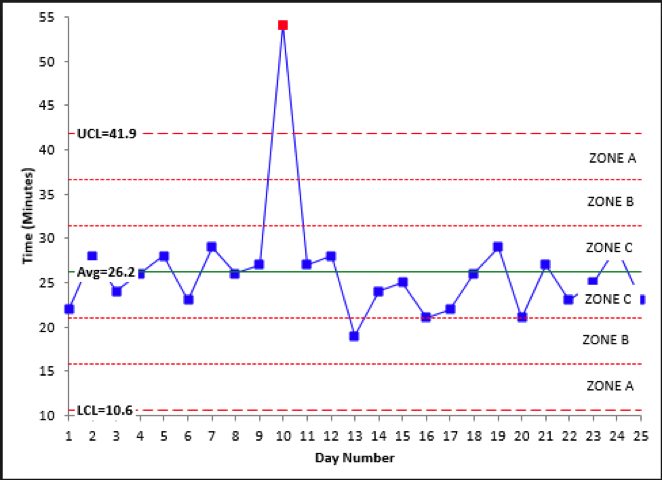
A control chart is a more sophisticated flowchart that shows how a workflow changes over time. It includes a line for the average, a line for the upper control limit (UCL), and a line for the lower control limit (LCL).
By comparing data on the current shipping workflow to these lines, warehouse managers can differentiate between normal fluctuations and unexpected spikes.
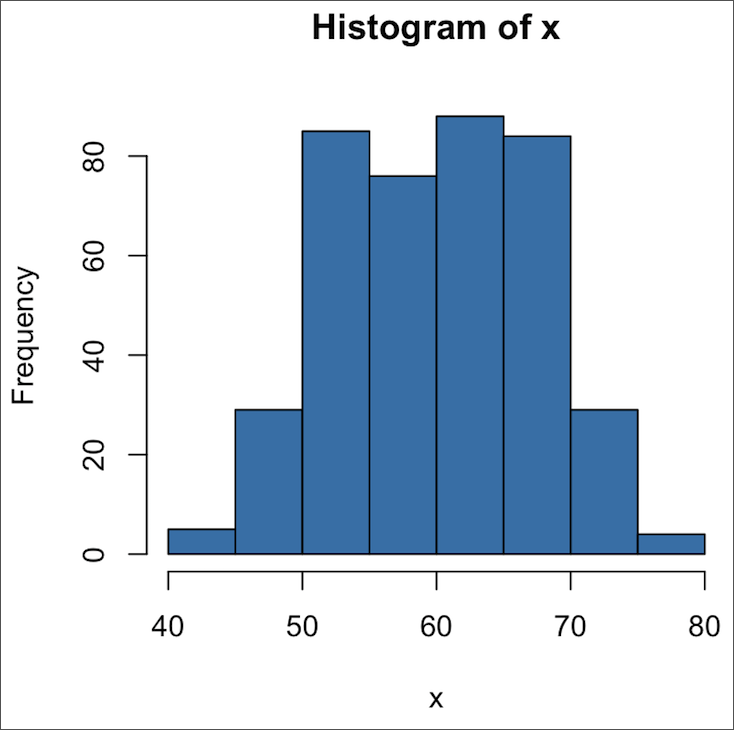
A histogram is a graph that shows how frequently a different value in a dataset occurs. It is also highly adaptable, but warehouse managers can only use it when the data is numerical and of the same type.
A warehouse manager can use a histogram to see which problems occur more frequently than others. Then, he can adjust the shipping workflow accordingly.
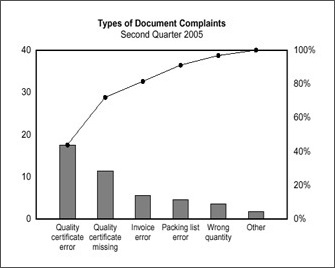
Created by Italian economist Vilfredo Pareto, a Pareto chart is a histogram that also shows the distribution of issues. The errors are listed in descending order of frequency, and the line represents the cumulative frequency.
Warehouse managers can use a Pareto chart to identify the most significant problem(s) and prioritize fixing those first. This prevents the warehouse team from resolving issues that won’t be as impactful.
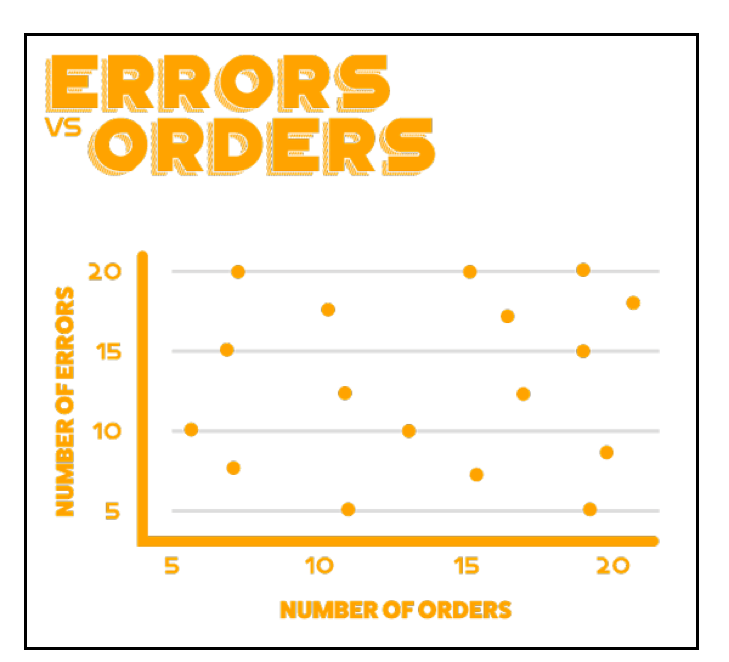
A scatter diagram helps illustrate the relationship between two variables. You can determine how intense two factors correlate or if they share a positive or negative relationship. This allows managers to know whether to further investigate the variables or look for something more relevant. For example, warehouse managers can use it to identify the relationship between the number daily orders and the number of errors.
Well-executed warehouse quality control procedures have the potential to significantly improve fulfillment accuracy. The challenge is adhering to them under the inevitable pressures of speed and urgency. But as long as you stay committed, your employees will follow suit.