


 Feature Spotlight


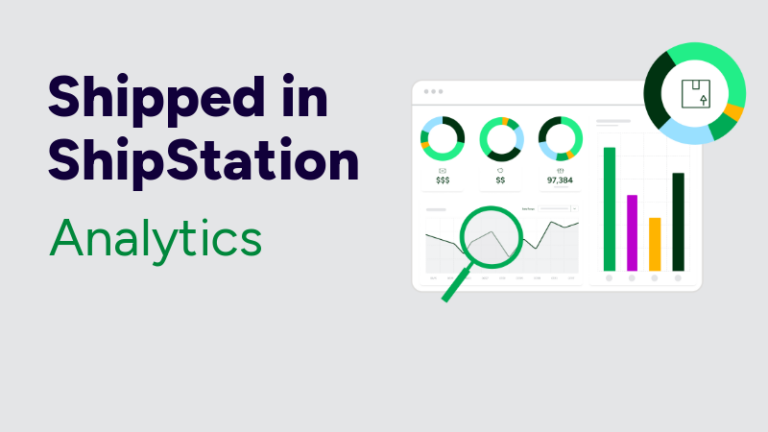
ShipStation Analytics turns your shipping activity into clear dashboards you can act on today. You’ll see where costs creep up, where time gets lost, and which carriers hit your delivery promise most often.
Growth feels great. Then the questions hit fast. Why did shipping costs jump last week? Why are “delivered late” tickets rising? Why is one warehouse lane always behind?
Without strong Analytics, you’re stuck pulling carrier CSVs, merging tabs, and hoping formulas still work. That takes time you don’t have. And it adds risk. One wrong filter can hide a real problem.
With ShipStation Analytics, you can make decisions while the work is happening. Same day. Same screen. That’s how you protect margin and keep your customers confident.
ShipStation Analytics is a foundational upgrade to how ShipStation surfaces your data. It’s built into the platform you already use, not a separate tool with another login. Your team gets answers where shipping decisions get made.
You also get a lot more depth. ShipStation Analytics consolidates over 100 shipping data points into purpose-built dashboards. You can filter by store, marketplace, carrier, service, region, and more, then drill in for details when something looks off.
ShipStation Analytics includes pre-built Shipping data dashboards designed for the real flow of pick-pack-ship. Each one targets a layer of your operation, so you don’t have to build reports from scratch just to get started.
Key dashboards include:
These views help you move from “I think” to “I know.” Fast.
Your customers don’t care which carrier you used. They care when the box shows up. Carrier performance tracking helps you see whether your delivery promise matches reality, across services and regions.
ShipStation Analytics makes it easier to compare results across major carriers you may use every day, like USPS®, UPS®, FedEx®, and DHL Express® and more. Instead of guessing which service is “usually fine,” you can validate it with real shipping history and current trends.
Use Carrier Performance to:
Small changes here can reduce “where is my order” noise and protect repeat sales.
Shipping cost optimization is often treated like a painful clean-up project. You wait. You export data. You reconcile carrier invoices. Then you find out you’ve been overpaying in a lane you ship every day.
ShipStation Analytics flips that. The Profitability Optimization dashboard breaks down shipping costs by carrier, service level, and region, so you can see where spend is going right now. Not weeks later.
Look for patterns like:
Better decisions start with visibility. Then automation can lock them in.
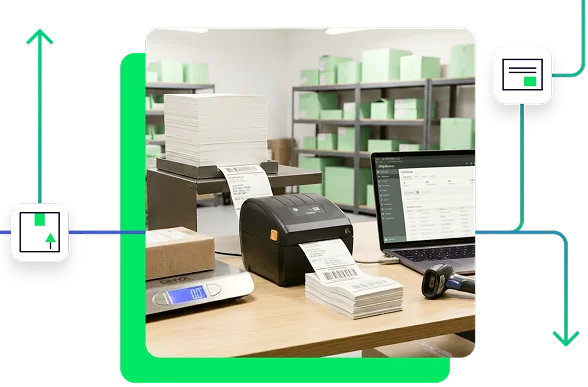
When the warehouse gets busy, time disappears in small places. A missed scan. A slow handoff. A label printed twice. Those minutes stack up.
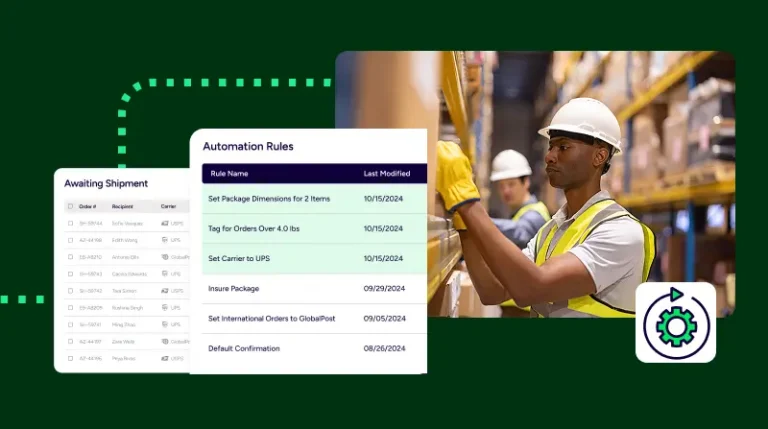
ShipStation Analytics gives you Ecommerce shipping insights that connect order flow to fulfillment output. With Order Status and Processing and Warehouse Operations, you can see where orders slow down from placement to shipment. That’s useful for a garage setup. It’s essential once you’ve got shifts and stations.
Pair insights with ShipStation tools you may already use:
You don’t need a heavy IT project. You need clarity and a few smart fixes.
Shipping isn’t only an ops cost. It’s a customer experience moment. When tracking feels confusing, your inbox pays for it.
ShipStation helps you keep customers in the loop with branded tracking pages and notifications. Add ShipStation Analytics, and you can connect the story. You see what’s shipped, what’s delayed, and what’s driving support volume.
Use the Shipment Tracking dashboard to:
Clear tracking plus clear Analytics keeps your brand in front, not the carrier’s.
Inventory problems show up as shipping problems. Stockouts create split shipments. Backorders create angry emails. And returns can quietly drain profit if you aren’t watching label cost and trend lines.
ShipStation Analytics brings those signals together. The Inventory Management dashboard includes low-stock alerts and smart reorder recommendations. It helps you plan, not scramble.
The Returns dashboard tracks total returns and label costs by store and carrier service, along with shipment status and tracking data. That makes it easier to answer questions like: Are returns rising for one product? Are return labels costing more than they should? Is one channel sending back more items than others?
You can also pair insights with ShipStation’s returns management portal, so customers can self-serve and your team can stay focused.
Every business ships a little differently. That’s why ShipStation Analytics includes Explore, a flexible way to build custom reports and dashboards from scratch. If pre-built dashboards get you 80 percent there, Explore helps you close the gap.
Explore is a big step forward if you’ve been searching for Shipping analytics software that fits a growing multi-channel operation without adding extra tools.
With Explore, you can:
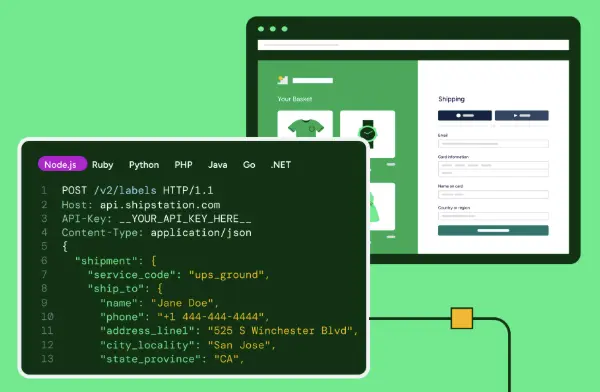
And if you manage orders through ShipStation’s API, dedicated API Analytics dashboards are available at shipstation.com/fulfillment/api/analytics, so API-fulfilled orders don’t become a blind spot.
See how ShipStation Analytics turns raw shipping data into decisions you can act on today. Walk through the dashboards, explore the data, and see what it looks like when everything is in one place.
ShipStation Analytics: explore the dashboards and see your shipping data in a whole new way.
If you manage fulfillment through ShipStation’s API, you get the same level of visibility, built specifically for API-fulfilled orders.
ShipStation API Analytics: full visibility into API-fulfilled orders, in the same suite.
Shipping moves fast. Your decisions should too. ShipStation Analytics gives you dashboards for carrier performance tracking, Shipping cost optimization, fulfillment speed, inventory signals, and returns trends, all inside ShipStation. No more waiting on exports. No more guessing.
Ready to see what your shipping data has been trying to tell you? Join the Optimizing Profits with ShipStation Analytics webinar, then put those insights to work in your daily workflow.
ShipStation Analytics is a built-in reporting experience that turns your shipping data into interactive dashboards and reports. It helps you manage costs, improve fulfillment, and track delivery trends without switching tools. It’s designed for real shipping work, not just end-of-month review.
You can track carrier performance, shipment status, shipping costs, processing flow, warehouse bottlenecks, inventory trends, and returns activity. The dashboards are purpose-built, so you can start with a clear view, then drill down when something needs attention.
Yes. The Profitability Optimization dashboard breaks down spend by carrier, service, and region so you can spot waste quickly. That makes it easier to adjust shipping rules, packaging choices, and service selections before overspend becomes a habit.
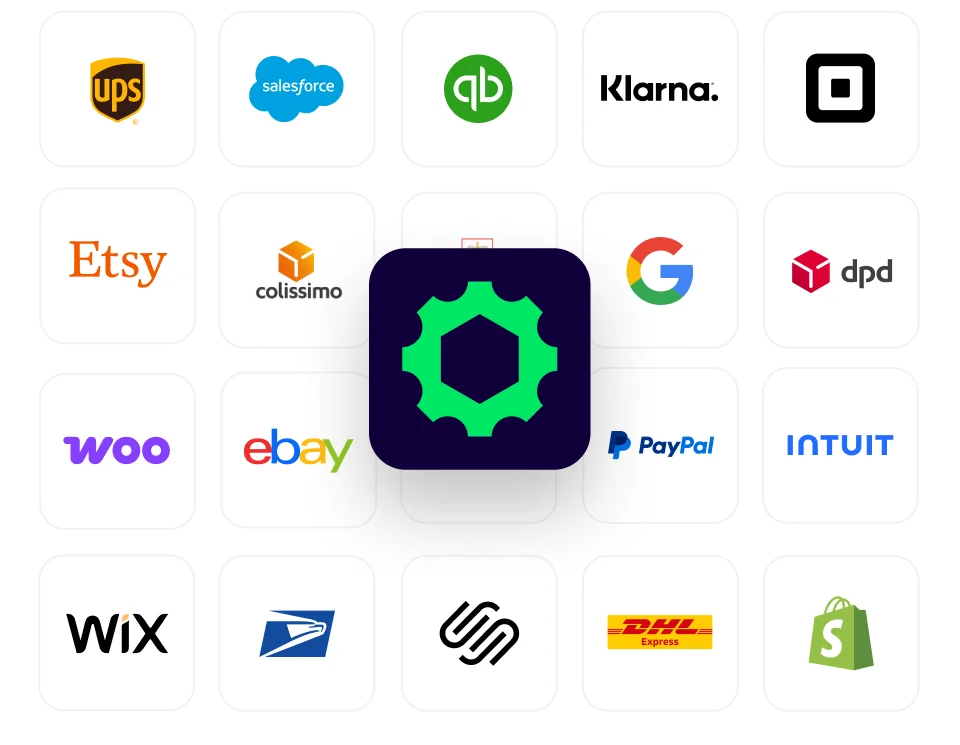
Yes. ShipStation Analytics works across the stores and marketplaces you connect to ShipStation, so you can compare performance by channel. That’s helpful if you sell through a webstore plus marketplaces like Shopify, Amazon, eBay, Etsy, or Walmart.
Yes. Explore lets you build custom reports and dashboards, save favorites, and schedule recurring emails. It’s a practical way to create Ecommerce shipping insights that match your operation, especially when you have unique workflows or reporting needs.