Back
Back






































 Feature Spotlight



Growth feels great—until the questions start piling up. Why did shipping costs jump last week? Why are “delivered late” tickets climbing? Why is one warehouse lane always behind the others?c
Without a clear view into your own data, you’re stuck pulling carrier CSVs, merging tabs, and hoping your formulas still work. That takes time you don’t have, and it adds risk. One wrong filter can hide a real problem until it costs you money. ShipStation Analytics is built to put those answers in front of you the moment you need them.
Here’s what the guessing game usually looks like day-to-day. You export shipment data from a carrier portal, drop it into a spreadsheet, and try to rebuild last month’s view from scratch. Meanwhile, support is fielding a rise in delivery complaints, and nobody can say for sure which carrier or which lane is causing it.
Without the right visibility, it’s hard to tell where your shipping spend is actually going, which service levels are underperforming, or which part of your fulfillment process is creating the bottleneck. Every one of those blind spots either costs you money directly or costs you the time it takes to track the answer down manually—time that’s better spent running your store.
ShipStation Analytics is a modern reporting solution built directly into ShipStation, designed to help you get more out of the shipping data you’re already generating. You don’t need a separate tool to log into or a CSV export to get a straight answer.
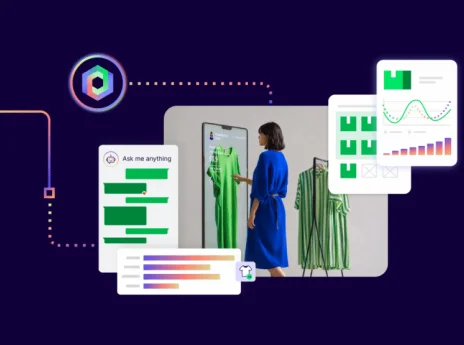
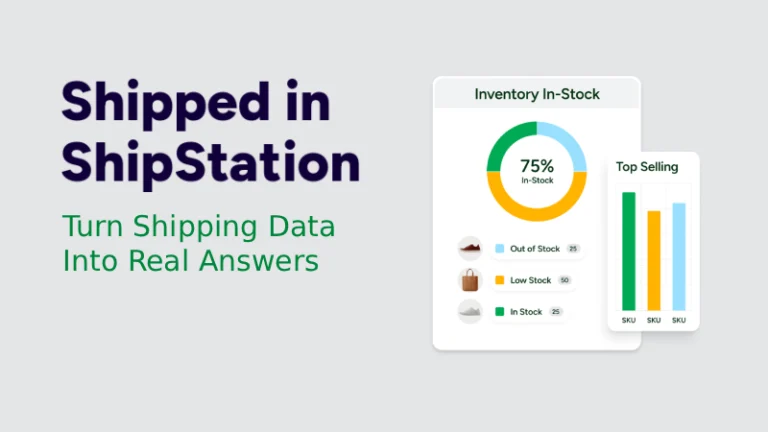
It works two ways. Dashboards give you a visual, at-a-glance read on performance—delivery times, carrier usage, order volume—so you can spot trends before they become problems. Reports give you structured details underneath: order details, shipped items, product sales, shipping costs, and batch details, all ready for reconciliation or deeper analysis. Between the two, you get both the headline and the receipts, without switching screens to find them.
Underneath those two views, ShipStation Analytics covers the full range of what you’d want to check on: Analytics Pages spanning your account overview, operations, sales trends, customer insights, and product highlights, plus more than 20 pre-formatted reports for orders, products, shipments, accounting, and inventory. If a pre-built view doesn’t quite match how you work, you can also build your own custom order and shipment reports, choosing exactly which fields show up and in what order.
Once you’re using ShipStation Analytics day to day, here’s the difference it actually makes:
Dashboards like Carrier Performance, Profit Optimization, Order Processing, and the Warehouse and Inventory dashboards are available starting on the Standard plan, with full access on Premium—so you can step into the depth of reporting that matches where your business is right now.
Picture a normal week that suddenly isn’t. Order volume ticks up, and a handful of “where’s my order” tickets land in support. Instead of digging through carrier invoices to find the source, you open your dashboard and filter to the last two weeks. One carrier’s on-time performance has slipped on a specific lane, such as shipping problems to a specific region, and it’s driving nearly every ticket.
You check the cost side for that same region and notice you’re paying more per shipment there than on your other services. Rather than waiting for next month’s invoice to confirm what you suspect, you adjust your carrier selection for that lane that same day—while it’s still a small fix, not a pattern your customers have started to notice.
Shipping moves fast, and so should your ability to see what’s happening inside it. ShipStation Analytics puts carrier performance, cost breakdowns, fulfillment speed, and customer experience data in one place—inside the platform you’re already using every day.
Ready to see what your shipping data has been trying to tell you? Start a free trial and explore your dashboards today.