Back








































 Shipping & Fulfillment


Shipping analytics shows you where money, time, and delivery performance are slipping. Good shipping analytics helps you spot late lanes, rising costs, weak carrier performance, and customer pain before those issues turn into refunds or support tickets. In this guide, you’ll learn which metrics matter, how to calculate them, how to build a useful shipping dashboard, and what to look for in shipping analytics software.
Shipping analytics is the practice of collecting and reading shipment data so you can improve cost, speed, and delivery results. It brings shipping metrics into a single view, instead of leaving them scattered across carrier portals, store reports, invoices, and spreadsheets.
At its core, shipping analytics answers simple but important questions such as:
That’s why parcel shipping analytics matters. A label tells you one shipment went out. Analytics tells you what happened across hundreds or thousands of shipments, by carrier, service, zone, store, product, or time period.
Website analytics tells you what happens before the order is placed. Shipping analytics tells you what happens after the buy button is clicked. You need both, but they solve different problems.
Website analytics tracks traffic, conversion, cart value, and checkout behavior. Shipping analytics tracks fulfillment metrics such as label volume, delivery speed, carrier performance, shipping costs, exceptions, and returns. One helps you win the sale. The other helps you keep the promise.
That difference matters because post-purchase problems often hide until customers complain. A store can convert well and still lose margin or loyalty if on-time delivery slips, first-attempt delivery falls, or surcharge costs keep rising.
Shipping analytics moves your team from reacting to complaints to preventing them. Instead of learning about a problem from a buyer, you see it in your shipping reporting first.
Without analytics, most shipping teams work from lagging signals. A customer asks where an order is. Finance sees invoices after the month closes. Ops notices delays only when the backlog gets loud. That’s too late. Shipping data lets you catch patterns sooner, such as:
That’s the real value of shipping business intelligence. It gives you a way to act before service problems spread.
The best shipping analytics programs start with a short list of metrics you can trust and act on. You don’t need fifty charts. You need the numbers that show cost, speed, reliability, and customer impact.
Start with these six. They work with most ecommerce brands and give you a clean view of parcel analytics across carriers, services, zones, and stores.
On-time delivery rate shows how often orders arrive by the promised date. It is one of the clearest measures of customer experience, and many shipping analytics tools label it as on-time delivery or delivery performance.
Use this formula:
On-time delivery rate = delivered on or before promised date / total delivered shipments × 100
This metric gets more useful when you break it out by carrier, service, and lane. A top-line number can hide a problem. One carrier may look fine overall, while one region or service is dragging the average down. Good looks like a steady trend, a narrow gap between promised and actual delivery, and no sharp drop during sales or peak periods.
First-attempt delivery rate measures how often a shipment gets delivered on the first try. It’s a strong signal for delivery quality because failed first attempts create extra cost, extra delay, and more customer frustration.
Use this formula:
First-attempt delivery rate = shipments delivered on first attempt / shipments with delivery attempts × 100
Track first-attempt delivery by carrier, service type, and destination pattern. If this metric drops, look for address issues, delivery timing problems, or service mismatches. A healthy trend stays stable across weeks, not only on quiet days. When first-attempt delivery improves, support load often drops with it.
Average transit time shows how long shipments spend in transit. It tells you whether your network is moving at the speed your promises require.
Use this formula:
Average transit time = total transit days / total delivered shipments
Average alone is not enough. You also need variance by carrier and lane. A three-day average can hide a pattern in which one lane swings from one day to the next. That kind of spread hurts planning, service promises, and customer trust. For shipping carrier performance analysis, compare average transit time by carrier, service, zone, and route. Good looks predictable. Fast helps, but steady matters more than one lucky average.
Cost metrics show whether your shipping offer still works. If you don’t measure shipping spend by order and zone, margin can slip without warning.
Use these formulas:
Cost per order = total shipping spend / total shipped orders
Cost per shipment by zone = shipping spend in a zone / shipments in that zone
Review these numbers by store, product mix, package type, and zone. Zone views matter because distance changes economics fast. One flat shipping offer may look fine at a blended level, while Zones 6 to 8 quietly erode profit. Strong shipping analytics software should help you break costs down by zone, not only by total spend.
Carrier exception rate tells you how often shipments encounter delivery problems. WISMO rate tells you how often customers ask, “Where is my order?” Together, they show where shipping issues become customer issues.
Use these formulas:
Carrier exception rate = shipments with an exception / total shipped orders × 100
WISMO rate = WISMO contacts / total shipped orders × 100
Read these side by side. If exception rate rises first, WISMO often follows. If WISMO is high but exceptions look low, your tracking updates may be weak or hard to find. Good looks like quick exception detection, clear status visibility, and fewer customer contacts tied to routine delays.
Return rate shows how much of your shipped volume comes back. That does not measure shipping alone, but it does reveal whether delivery quality, damage, speed, or expectations are hurting retention.
Use this formula:
Return rate = returned orders / delivered orders × 100
Break this out by carrier, service, product, and reason code when you can. A rising return rate after a service change can indicate late delivery, damaged goods, or a poor fit between the shipping method and the product type. Strong fulfillment analytics connects returns back to the original shipment so you can see patterns, not isolated cases.
Shipping data is most useful when it helps you judge carrier performance with facts, not anecdotes. If you only review carrier results at a high level, weak lanes stay hidden.
Carrier accountability starts with consistent measurement. Track the same set of metrics for each carrier and service over the same date range. Then break those numbers down by carrier and lane, because that’s where most service differences appear. This is where shipping performance analytics vendors earn their keep. They help teams move from “this carrier feels slow” to “this service underperformed in these regions during these weeks.”
A carrier scorecard gives you a repeatable way to compare service quality and cost. Keep it simple, or it won’t get used.
Build your scorecard around these fields:
Review the scorecard monthly and weekly during peak periods. The goal is not to “rank” carriers for bragging rights. The goal is to know which service works best for which shipment type and destination. Good parcel shipping analytics makes those patterns clear fast.
Shipping analytics helps with carrier negotiations by showing where performance supports the rate and where it doesn’t. That changes the conversation from opinion to evidence.
Bring three things into any review:
Then ask practical questions. Where did transit time slip? Which zones drove exceptions? Which services most often missed the promise? Where did surcharge costs rise? Even if your rates stay the same, better reporting can support service changes, lane shifts, or volume moves that protect margin and delivery results.
Shipping analytics improves the delivery experience when you use it to guide customer communication, not only internal reporting. Data should lead to action customers can feel.
That means watching delivery speed, exception trends, and tracking visibility together. When analytics shows a problem, your next move should be clear. Update delivery messaging. Shift volume. Change service rules. Tighten alerts. A better delivery experience does not come from a single chart. It comes from a loop: measure, act, check, repeat.
WISMO drops when customers can see what’s happening without having to ask. Analytics helps you find where communication needs work, and branded tracking plus real-time notifications help fix it.
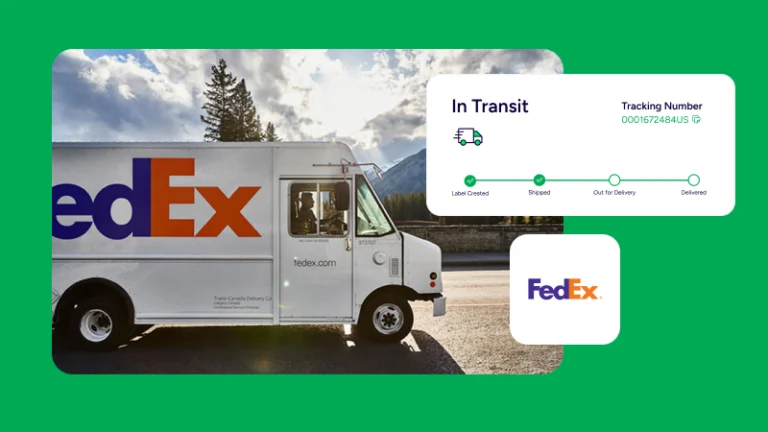
Start by comparing WISMO contacts against delivery status events. If customers ask most often during one status gap, that’s your weak point. If one carrier creates more “in transit” uncertainty, adjust expectations earlier. ShipStation supports branded tracking pages, real-time notifications, and self-service returns. Used together, those tools keep customers informed and reduce the need for manual status checks.
That’s one of the clearest links between shipping analytics and customer experience. The data shows the friction. The post-purchase flow removes it.
Exception management works best when teams see risk early. Shipping analytics should help you spot delayed, stalled, or failed deliveries before they trigger an angry email.
Create a daily exception view that flags:
Then match each problem to a response. Some orders need a message. Some need a carrier follow-up. Some need future routing changes. Strong shipping business intelligence is not passive. It surfaces exceptions in time for your team to act on them.
Parcel shipping analytics helps with last-mile planning by showing how delivery performance varies by region, service, and season. It also helps you see when order volume is about to stress your current workflow.
Look at historical shipment count, average transit time, exception rate, and cost by week. Then compare that with peak events, promotions, or weather periods. If one lane slows every holiday season, don’t wait for it to happen again. Shift service rules earlier. If one warehouse creates higher zone costs for a growing region, review routing or location strategy.
This matters during spikes. ShipStation processed 28.5 million labels during Cyber Week 2024 with no performance lag. Scale is one thing. Planning is another. A solid shipping dashboard helps you prepare labor, packaging, carrier mix, and customer promises before the rush starts.
The best shipping analytics software should make decisions easier, not create more data cleanup. If a tool cannot combine shipping cost, delivery speed, carrier performance, and reporting in one place, it will leave your team back in spreadsheets.
When you compare shipping performance analytics vendors, look for tools for managing and analyzing parcel shipping data that cover these basics:
Good shipping analytics tools should also support fulfillment analytics beyond delivery speed, including cost control, return insights, and operational trends.
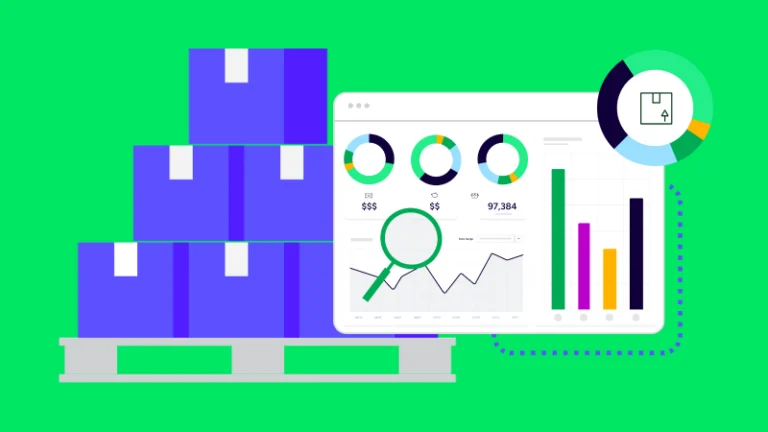
ShipStation helps turn shipping analytics into usable daily reporting with dashboards, reports, and exports in one place. That matters when you need both quick answers and deeper review.
ShipStation Analytics includes built-in interactive dashboards for high-level trends and detailed reports for structured analysis. Dashboards help you track metrics like delivery times, carrier usage, and order volume at a glance. Reports provide details on shipments, shipping costs, products, accounting, inventory, and batch reviews. ShipStation also offers more than 20 pre-formatted reports, as well as custom order and shipment reports, raw data exports, and monthly data archives.
Shipping analytics is most valuable when it turns data into action. By tracking key metrics and reviewing performance across carriers, services, zones, and shipping lanes, you can make smarter decisions about costs, delivery performance, and the customer experience.
ShipStation makes that easier with ShipStation Analytics, bringing interactive dashboards, detailed reports, and data exports together in one place. Monitor trends like delivery times, carrier usage, and order volume at a glance, or dig deeper into shipment details, shipping costs, products, accounting, inventory, and batch activity. With more than 20 preformatted reports, plus custom order and shipment reports, raw data exports, and monthly data archives, you have the flexibility to turn shipping data into actionable insights.
Start a free trial of ShipStation to bring your shipping data together and make reporting work harder for your business.
Shipping data analytics is the process of collecting and analyzing shipment, delivery, and cost data to improve fulfillment decisions. It usually includes delivery speed, shipping spend, carrier performance, exceptions, and returns. The goal is simple: turn raw shipment activity into actions that protect margin and customer experience.
Start with on-time delivery rate, first-attempt delivery rate, average transit time, cost per order, cost per shipment by zone, exception rate, WISMO rate, and return rate. Those metrics show whether orders arrive on time, what they cost, and where service breaks down. Then segment them by carrier, service, zone, and lane.
Shipping analytics reduces WISMO by showing where delivery uncertainty starts. When you can see delays, stalled scans, and weak status visibility early, you can improve tracking updates and customer messaging before buyers reach out. Branded tracking pages and proactive notifications help close that gap.
Shipping analytics gives you proof by carrier, service, and lane, rather than broad complaints. You can bring on-time delivery, transit time, exception rate, and cost data into the discussion and show where service supports the rate and where it does not. That leads to better reviews, smarter routing, and stronger negotiating leverage.
Shipping analytics helps with seasonal planning by showing how order volume, transit time, exception rate, and shipping cost change over time. That history helps you plan staffing, packaging, service rules, and customer promises before peak periods hit. It also helps you spot lanes that consistently struggle during periods of high demand.
Website analytics focuses on behavior before purchase, such as traffic, conversion, and checkout performance. Shipping analytics focuses on what happens after purchase, such as delivery speed, carrier performance, costs, and returns. One helps you win orders. The other helps you fulfill them well.